CCHPP (Cornell Combined Heat and Power Plant)
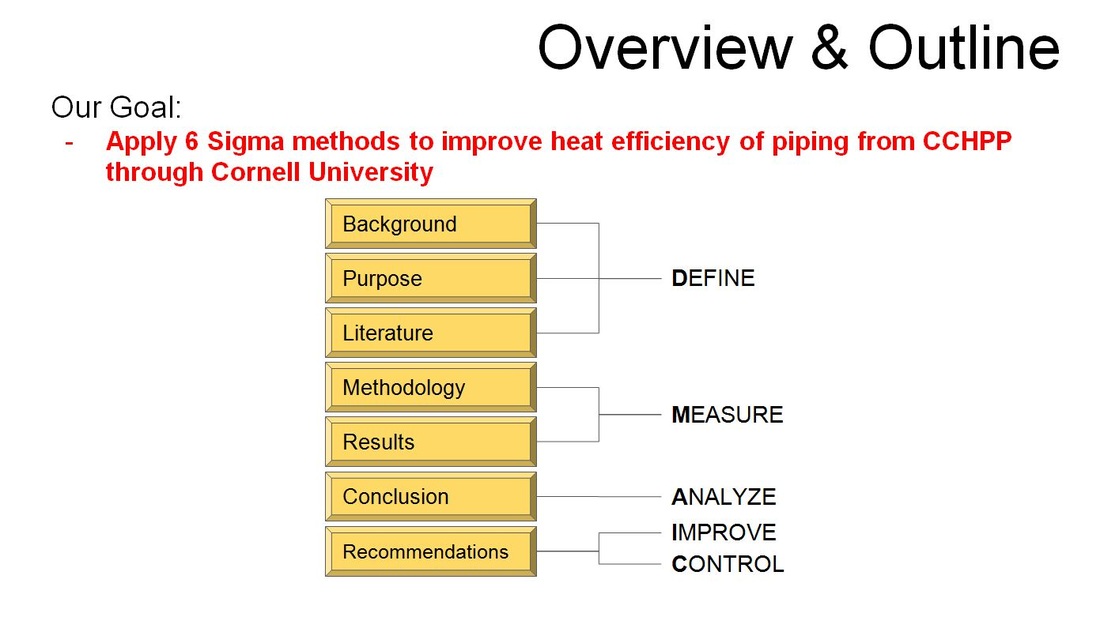
An investigation in Cornell's Combined Heat and Power Plant temperature losses provides valuable insight into the efficiency and areas for improvement in the system's overall reliability and operations. This investigation utilizes:
- Fishbone Diagrams
- Failure Modes Effect Analysis (FMEA)
- Temperature Loss Calculation and Simulation
- Design of Experiements (DoE)
|
|
|
|
|
|
|
|
|
|
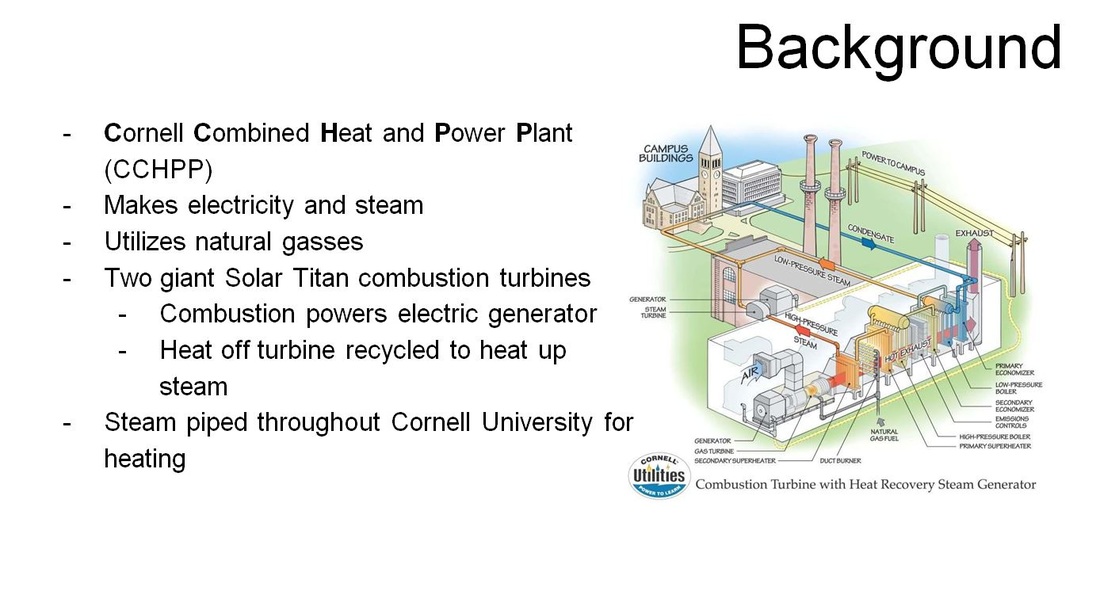
Introduction of CCHPP
Beginning operations in 1922, the Cornell Combined Heat and Power Plant (CCHPP) utilizes combined heat and power (CHP) to simultaneously generate electricity for Cornell University while using the excess heat generated for heating Cornell's campus. Driving the combined heat and power process are two large Solar Titan combustion turbines - each 15 MW - that combust natural gas to power electric generators and Rentech heat recovery steam generators that recycle the heat given off by the turbines into steam - now reduced in pressure and temperature - which is then piped throughout Cornell University for heating. Through CHP, the CCHPP generates ~180 million kWh per year for Cornell University's electricity usage.
The heating system at Cornell University is driven by the heated steam that is pumped from the CCHPP. The heated steam travels through an intricate network of pipes that lies through out Cornell University and services the entirety of the campus including West Campus, North Campus, East Campus, Central Campus, and South Campus regions. The steam pipes that are installed throughout the campus include those underground and above ground and consist of five types of installations (an installation is the make of the pipe, its insulation, and how it is installed): Box Tunnel, Ricwil/Permapipe, Direct Buried Foam Glass, Clay Tile Tunnel, and Above Ground. These pipes branch into each Cornell University building - where the heated steam then flowed into each individual building's piping networks to provide convection heating. The heating provided to each building are then able to control the amount of heating desired by determining how much steam to receive from the main pipeline.
Additionally, any left-over steam and condensate from the buildings are piped back to the CCHPP through a different albeit similar piping network for recycling to be reheated into purposeful steam once more by the Titan turbines' heat. Through this, the CCHPP is able to keep addition of more water to a minimum and assist the heated steam generation efficiency.
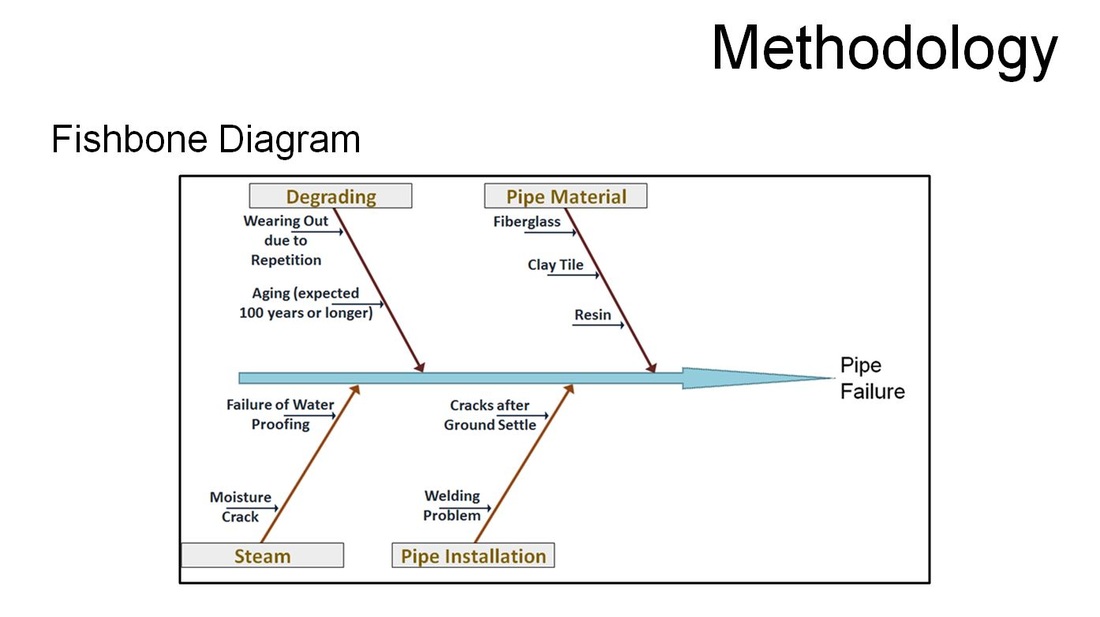
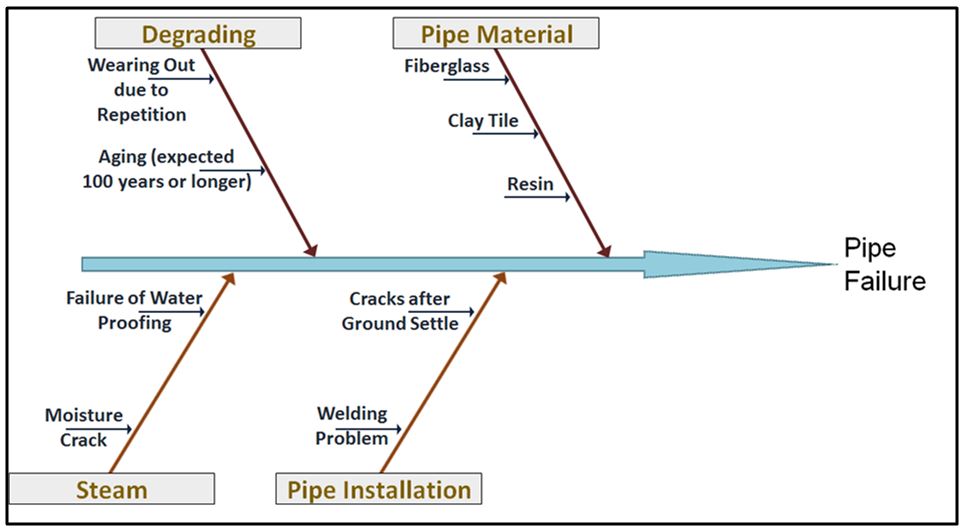
Fishbone Diagram
The Fishbone diagram categorizes many potential causes of problems or issues in an orderly way and identifies root causes. It can be used to structure a brainstorming session. It immediately sorts ideas into useful categories.
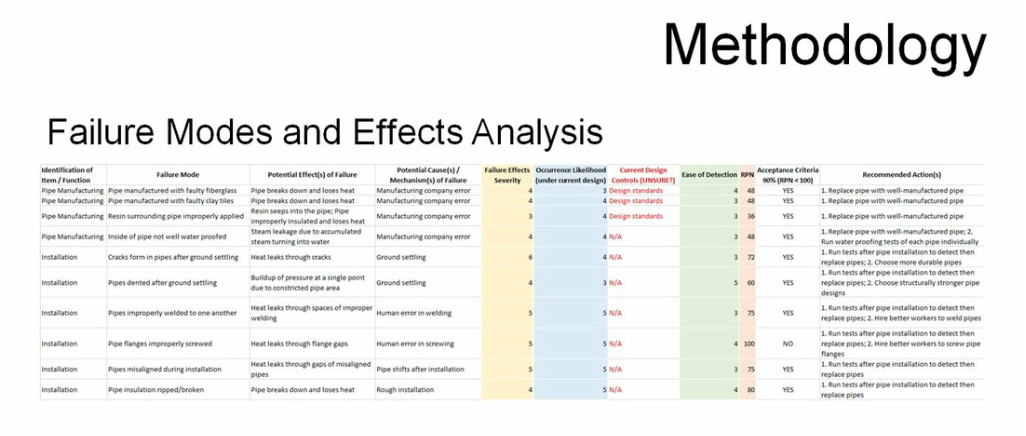
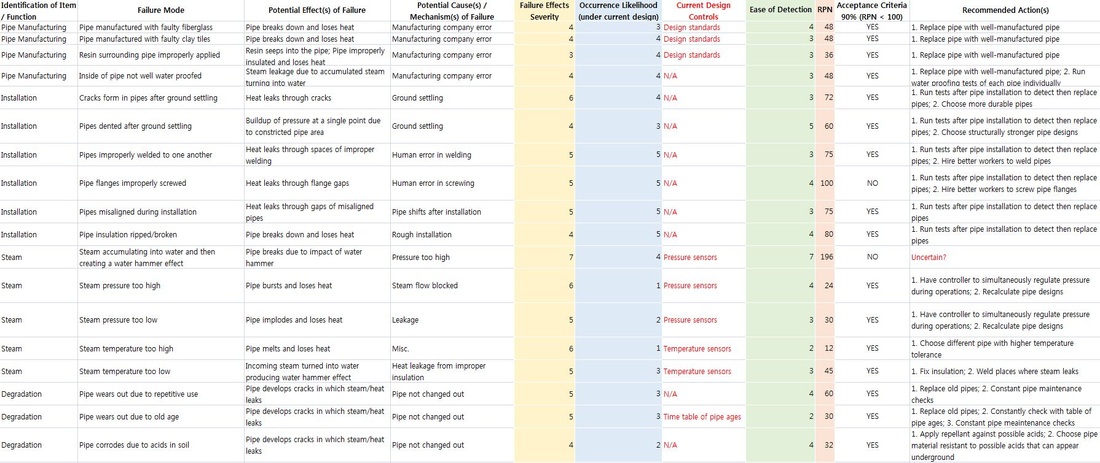
Failure Modes and Effects Analysis (FMEA)
FMEA is a Six Sigma tool that identifies the way a product/project may fail, its causes of failure, how risky the failure is, and possible adjustments to prevent the failure. The core of this tool is in defining all possible failure modes of a project and then proceeding to develop counter measures to avoid said failure modes based on the possible causes the severity. The risk behind the failure modes is calculated by the Risk Priority Number (RPN) which is the product of the severity, likelihood, and ease-of-detection of the failure. The higher the RPN number, the more important it is that the failure mode needs to be addressed immediately. In essence, the FMEA allows the design team to address possible issues to a project and then prioritize revisions based on the importance of each issue.
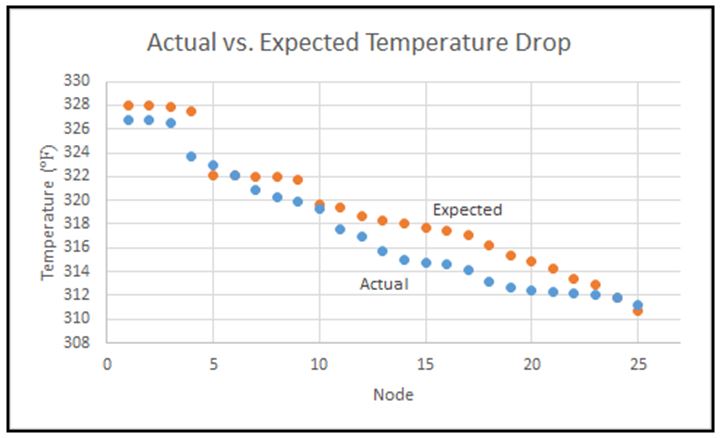
Calculation & Simulation
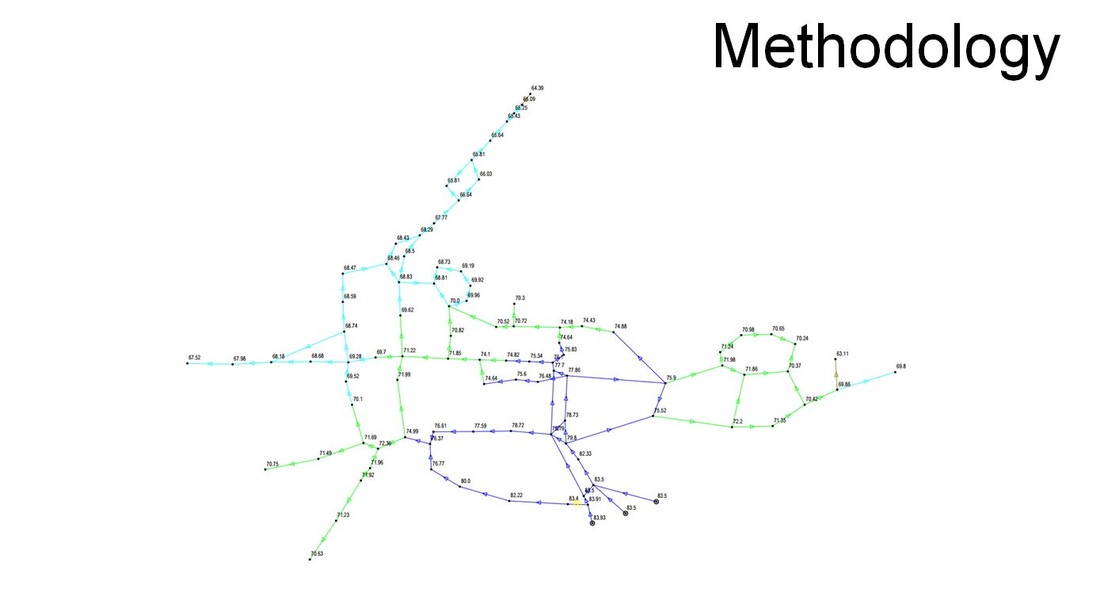
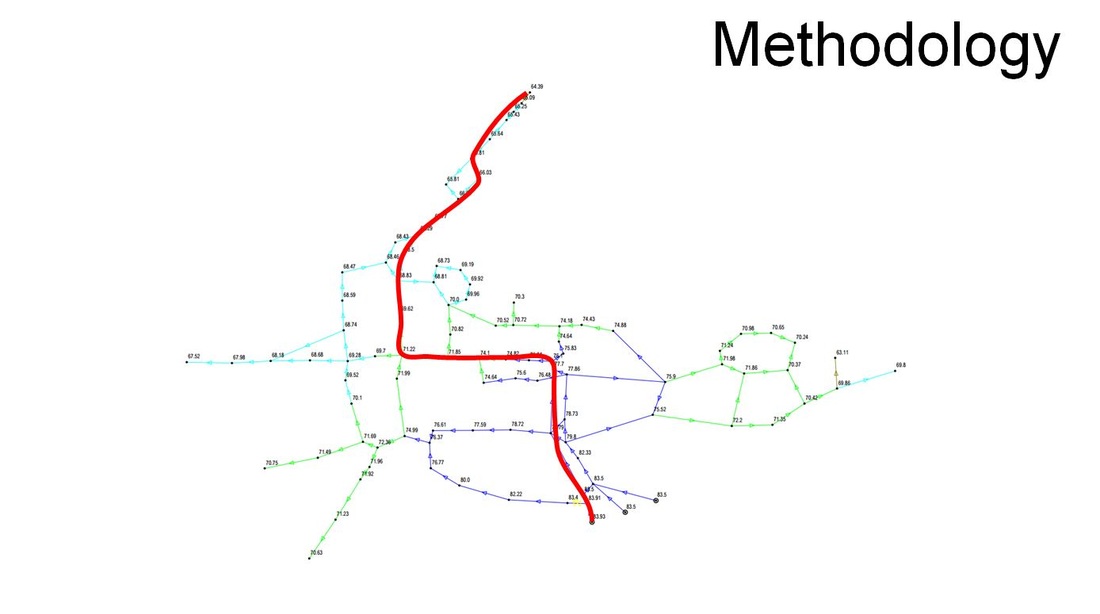
The distribution network is based around the heat input lines and the heat output lines, so analyzing any of the main lines on any side of the campus will give us a fairly good estimate of the losses that occur in the system. Because of this, we have chosen to analyze the main line that runs from the CCHPP to the farthest point on North Campus, which will give the longest possible route in the system. Using the diagram of the Cornell University Steam System Map, we can follow the trail of nodes from CCHPP all the way up to the NC Node and gather together a set list of all segments used to get there. From here, the information for the construction of each segment is known, allowing us to calculate the different expected losses associated with each segment and then later compare this with the actual losses.
Due to the different constructions of piping in the line that we are analyzing, we require a look at the different makeups of each of the pipes utilized in order to calculate the losses expected in each one. There are five different piping types included within the system we will analyze.
Due to the different constructions of piping in the line that we are analyzing, we require a look at the different makeups of each of the pipes utilized in order to calculate the losses expected in each one. There are five different piping types included within the system we will analyze.
- Box Tunnel
- The Box Tunnel construction type consists of a pipe being installed in a rectangular tunnel underground. The geometry of the rectangular tunnel helps with heat efficiency of the steam pipes.
- Ricwil (Permapipe)
- The Perma-pipe manufactured by the Ricwil corporation are made with high temperature systems in mind and consists of a pipe-in-pipe make with an air space between them to make them drainable and dryable. This construction type is pre-insulated and directly buried into the ground with an approximate lifetime of 10 years.
- Direct Buried Foamglas
- The Foamglas construction type consists of a regular pipe with lightweight, cellular glass foam for insulation which helps with heat conservation, where each cell in the foamglas is an insulating space. It is manufactured in block form then cut and shaped to fit around pipes. The construction type is directly buried underground and is noncombustible, is easy to install, requires low maintenance, and provides an approximate lifetime of 25 years.
- Clay Tile Tunnel
- The clay tile tunnel construction type is the common and older installation type of the five types. This construction type has been utilized in many older buildings and is known to be reliable - appriximating a lifetime close to 100 years. However, the cost of construction and installation of this type is extremely high and requires a great deal of time.
- Above Ground Type
- The above ground construction type is series of pipes that are exposed to the outside atmosphere, as the name suggests. These construction types are made with insulation that takes into consideration the difference in temperature between the heat in the pipe and the outside temperature. Nonetheless, the amount of above ground type pipes are minimized in order to avoid such exposure to drastic temperature differences.
Design of Experiments (DoE)
DoE is a systematic method to determine the relationship between factors affecting a process and the output of that process. In other words, DoE is used to find cause-and-effect relationships. This information is needed to manage process inputs in order to optimize the output.
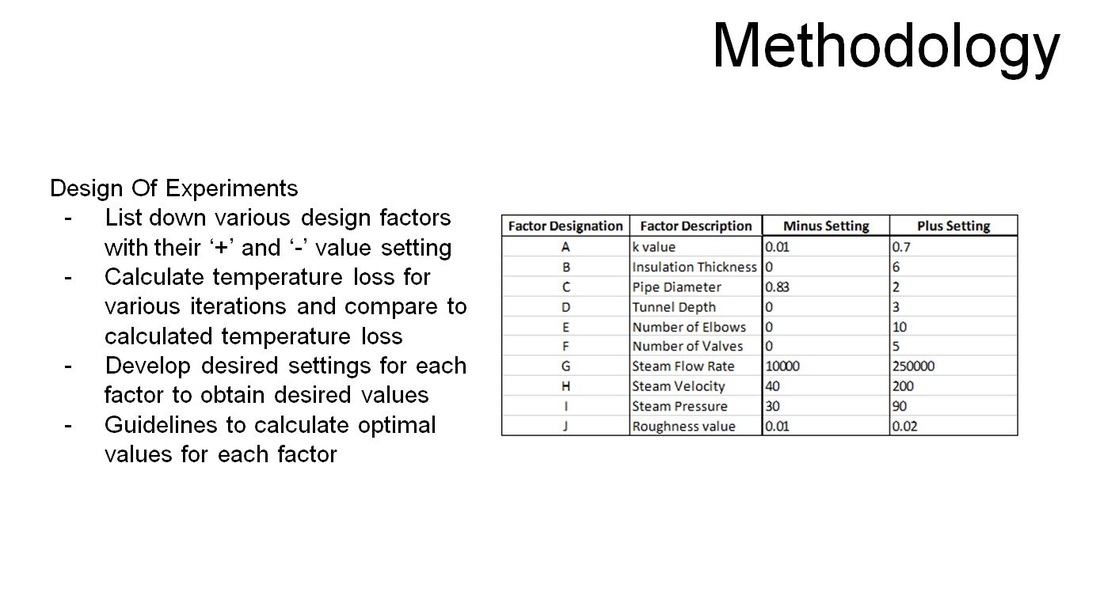
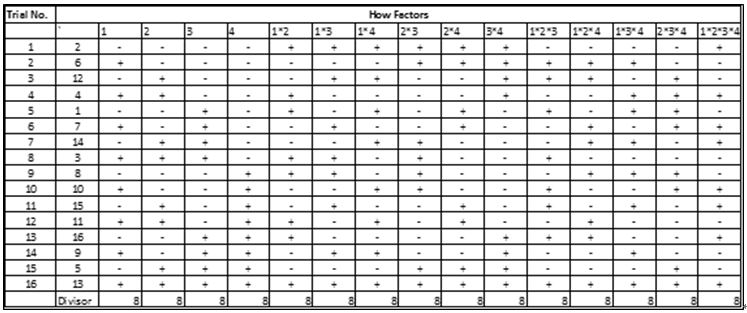
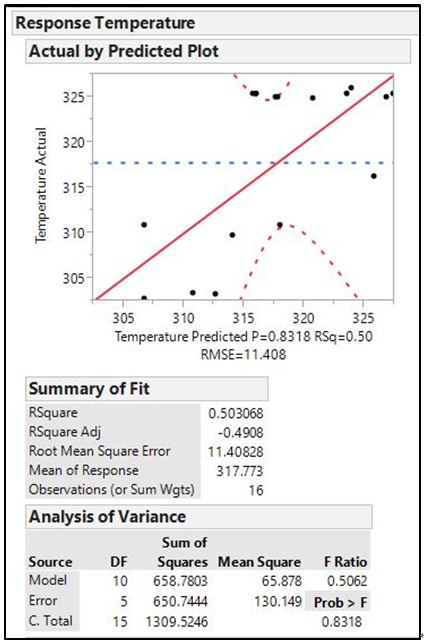
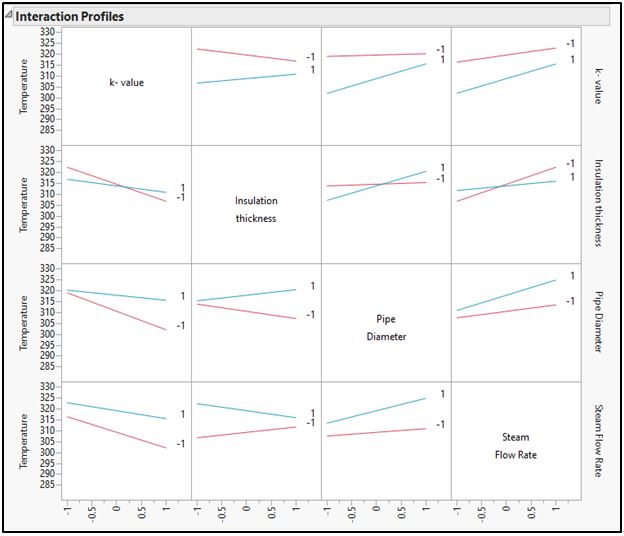
The group initially drew up a list of 10 factors that affect the amount of heat loss in the pipe, thus ultimately leading to the drop in its temperature. Then, factors were narrowed down to four: k-value of the insulation material, the insulation thickness, the pipe diameter, and the steam flow rate inside the pipes. A table of contrast was prepared accordingly. The output values were calculated through the relevant formulae and the DoE was carried out via JMP using 2^4 factorial analysis methods on the longest section of the pipe to accentuate the changes in the temperature clearly. Minus and plus range values for each of the factors were set up afterwards.
The group initially drew up a list of 10 factors that affect the amount of heat loss in the pipe, thus ultimately leading to the drop in its temperature. Then, factors were narrowed down to four: k-value of the insulation material, the insulation thickness, the pipe diameter, and the steam flow rate inside the pipes. A table of contrast was prepared accordingly. The output values were calculated through the relevant formulae and the DoE was carried out via JMP using 2^4 factorial analysis methods on the longest section of the pipe to accentuate the changes in the temperature clearly. Minus and plus range values for each of the factors were set up afterwards.
|
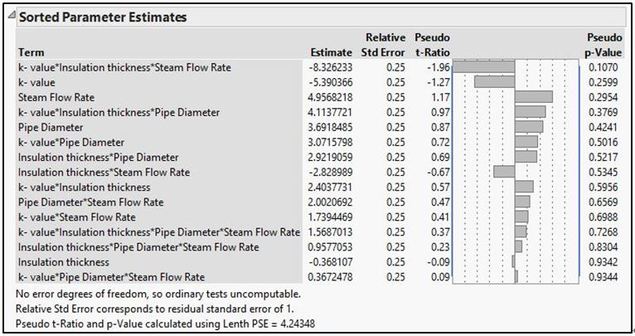
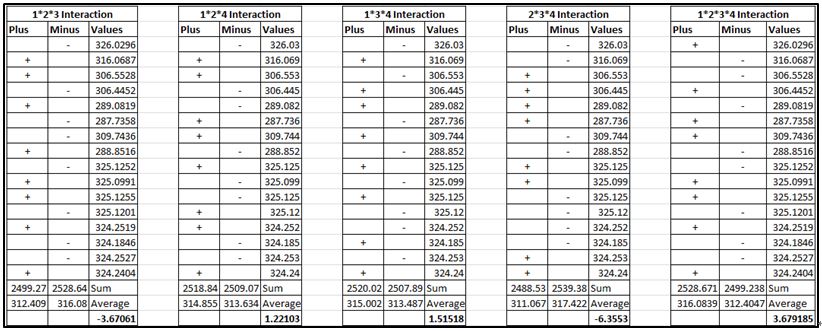
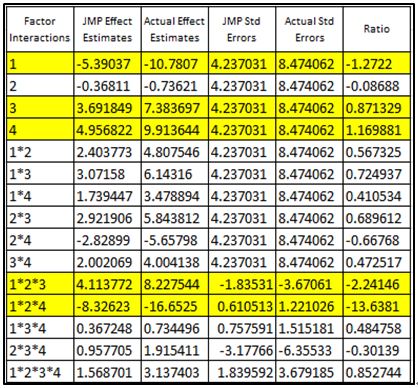
In JMP, the group obtained the trends which indicated the importance of each factor individually as well as the interaction with the other factors. The effect estimate parameters were then compared with the standard error estimates to distinguish coincidental changes in temperature to considerable changes in temperature indicating factors that yielded better result over others.
|
|
|
These effects were then compared to their corresponding standard errors. Factors were deemed to be significant only when the ratio of the effects to the standard errors was close to 2 or greater. The highlighted row indicates significant factors.
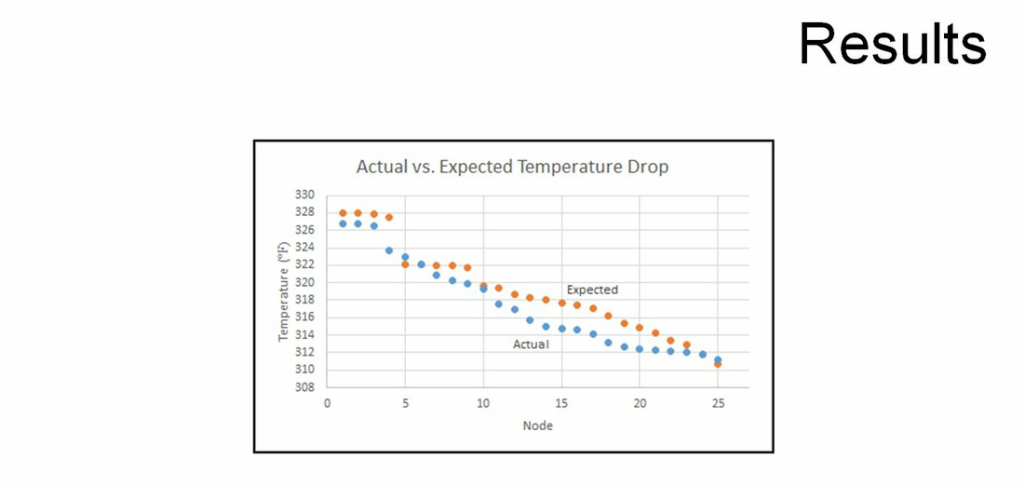
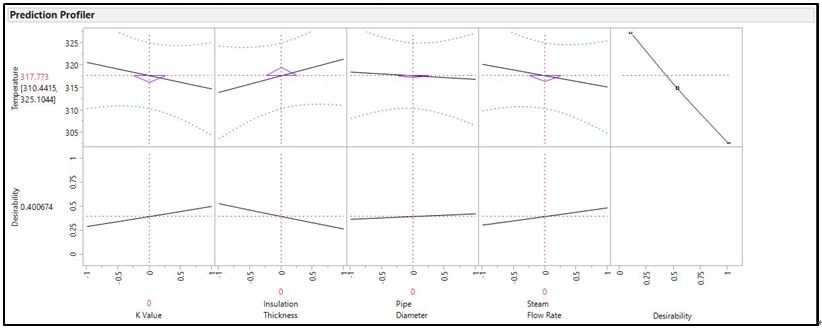
The initial condition in the pipe yielded in a temperature drop of 0.045164 F. After running the factorial analysis and interpreting the effects of the significant factors, the group decided to make changes to input values. The changes resulted in a drop in temperature to be 0.010562 F, which is an improvement of 327% over the initial value. |
